Igneous And Metamorphic Petrology
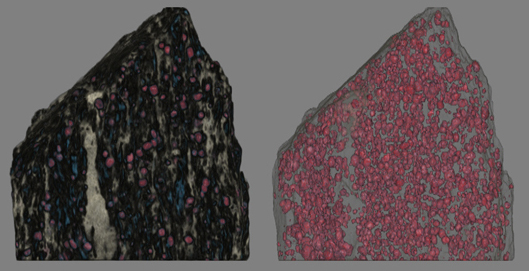
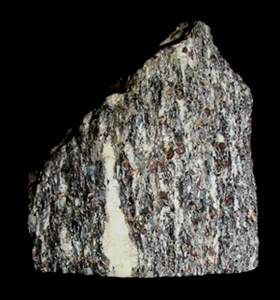
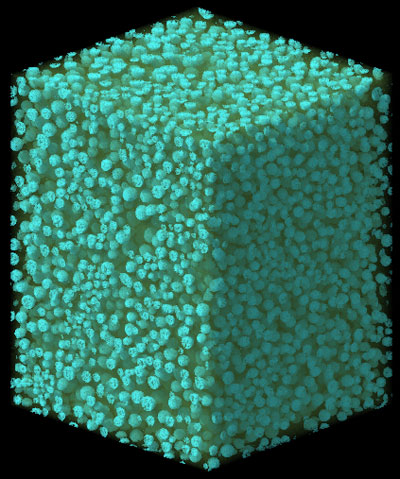
CT is a natural and powerful extension to traditional petrographic analysis, as it allows observations and measurements to be extended into three dimensions. At its simplest, the data can be visualized to observe the textural relationships among phases and structures. For example, 3D visualization of a diamondiferous eclogite revealed that diamond was never enclosed in garnet, and always associated with alteration zones in clinopyroxene. Active research at UTCT is also dedicated to creating means to routinely extract quantitative measurements from volumetric data. In the garnet-kyanite schist shown below the size and spatial distribution of more than 2,000 garnet crystals was measured.
-
- Migmatitic garnet-amphibolite (animation)
-
- Migmatitic garnet-amphibolite
-
- Migmatitic garnet-amphibolite
-
- Vesicles in basalt
-
- Vesicles in basalt

-

- Vesicles in basalt
-
- Diamondiferous eclogite
-
- Single scan of a garnet-kyanite pelitic schist
-
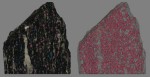
- Pseudocolored garnet-kyanite pelitic schist
-
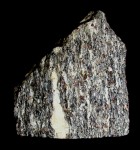
- garnet-kyanite pelitic schist
-
- Garnet-staurolite schist
-
- Diamondiferous eclogite
-
- Diamondiferous eclogite
-
- Diamondiferous eclogite (animation)
-
- Inclusions in Carbonado
-
- Experimental Vesicles
Planetary Geology
Meteorite research at UTCT has involved gathering quantitative measurements from volumetric data, such as vesicle size distributions, impact breccia clast identification and measurement, and degree of metal-melt segregation. In one example, more than 32,000 vesicles were analyzed in the Ibitira vesicular basalt meteorite to help infer the asteroidal conditions under which they formed.
-
- Meteorite impact products
-

- Meteorite impact products
-
- Meteorite impact products
-
- Meteorite impact products

-
- Meteorite impact products
-
- Meteorite impact products

-
- Meteorite impact products
-

- Meteorite impact products
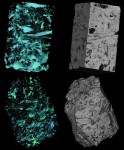
Ore Deposit Geology
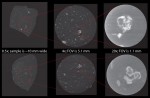
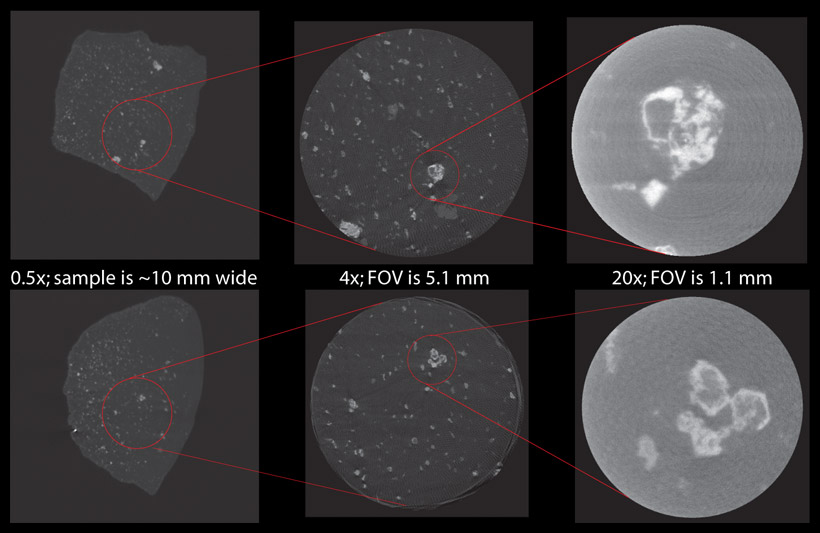
CT investigations of ore samples include examining grain-scale relationships between gold and associated ore minerals, evaluating the relationship between structural features and gold deposition, and fluid inclusion investigations. Analysis of a mineralized quartz core demonstrated that native gold grains were invariably associated with chalcopyrite.
-
- Trace phase petrography
-
- Sheared quartz vein
-
- Fluid inclusions
-
- Exploration drill core
Hydrology, Sedimentology and Petroleum Geology
CT allows imaging and quantification of three-dimensional void structure in solid rocks and soils, opening up new avenues to improve our understanding and characterization of the way fluids reside in and move through the subsurface. Pores and fractures larger than a few microns can be imaged directly, and void space at all scales can be measured by scanning samples in varying conditions of saturation. Such analyses can reveal the varying ways in which porosity is hosted by different rock components, and enable estimation of direction and degree of flow anisotropy.
-
- Carbonate core
-
- Carbonate core
-
- Carbonate core (animation)
-
- Sandstone porosity
-
- Saprolite core
-
- Rudist reef

Environmental Geology
CT can reveal the internal structure of materials such as corals and speleothems (cave deposits) that record aspects of their environment as they grow through time. Proper geochemical analysis of these materials requires accurate location of banding and growth axes, which can often be readily detected with CT. CT has also been used to study the skeletal basis for growth banding in corals.
-

- Scleractinian coral
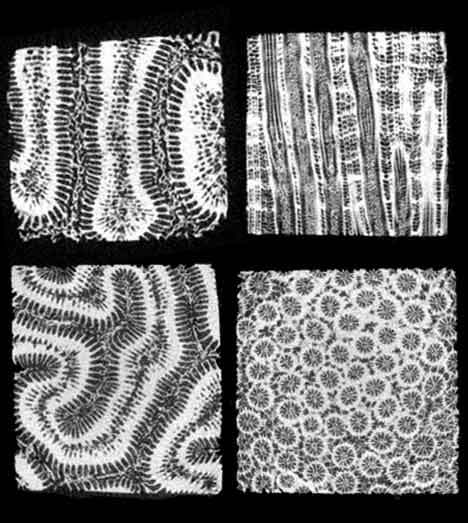
-
- Coral Montastrea annularis
-
- Coral Montastrea annularis