
Although the output of computed tomography is visual in nature and thus lends itself to straightforward interpretation, subtle complications can render the data more problematic for quantitative use. Scanning artifacts can obscure details of interest, or cause the CT value of a single material to change in different parts of an image. Partial-volume effects, if not properly accounted for, can lead to erroneous determinations of feature dimensions and component volume fractions. In this section we discuss commonly encountered problems, and some approaches for solving them.
Beam Hardening
The most commonly encountered artifact in CT scanning is beam hardening, which causes the edges of an object to appear brighter than the center, even if the material is the same throughout (Fig. 5a). The artifact derives its name from its underlying cause: the increase in mean X-ray energy, or “hardening” of the X-ray beam as it passes through the scanned object. Because lower-energy X-rays are attenuated more readily than higher-energy X-rays, a polychromatic beam passing through an object preferentially loses the lower-energy parts of its spectrum. The end result is a beam that, though diminished in overall intensity, has a higher average energy than the incident beam (Fig. 2). This also means that, as the beam passes through an object, the effective attenuation coefficient of any material diminishes, thus making short ray paths proportionally more attenuating than long ray paths. In X-ray CT images of sufficiently attenuating material, this process generally manifests itself as an artificial darkening at the center of long ray paths, and a corresponding brightening near the edges. In objects with roughly circular cross sections this process can cause the edge to appear brighter than the interior, but in irregular objects it is commonly difficult to differentiate between beam hardening artifacts and actual material variations.
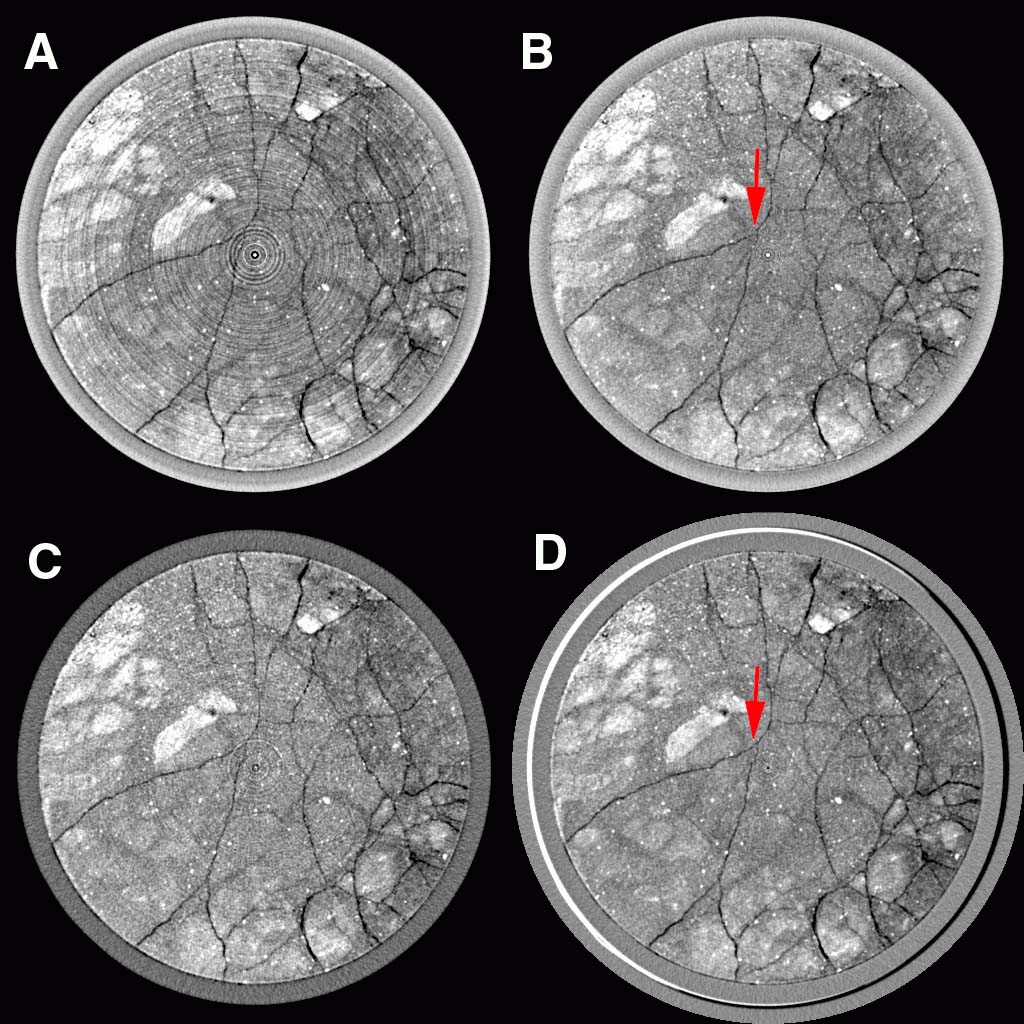
Figure 5: Scans through a 6-inch-diameter column of saprolite encased in PVC pipe, showing scanning artifacts and the results of various strategies for remedying them. The scans all represent 1-mm-thick slices collected with the X-ray source at 420 kV and acquisition times of 3 minutes. Scan (A) shows both ring and beam-hardening artifacts. The latter is visible most obviously as the bright ring around the outer part of the PVC. Image (B) is the result of a software correction of the ring artifacts in (A). If the grayscale fluctuations caused by the rings are smaller than for the features of interest, this approach can be very successful. However, in this case some fractures close to the center have been obscured or altered. Image (C) shows the result of pre-filtering the X-ray beam by passing it through 6.35 mm of brass. Beam-hardening and ring artifacts have been reduced markedly but not totally, and image noise has increased considerably. The scan shown in (D) was done using a self-wedge calibration through a relatively homogeneous portion of the column. The bright rim on the left was caused by imperfect centering of the column; the image of the saprolite itself, however, has only very minor ring artifacts and no beam hardening. Note that although the centers of images (B) and (D) are similar, the edges of the saprolite are brighter in image (B). Thus it is evident that the beam hardening artifact in image (B) was not confined strictly to the edge of the PVC casing, but was a continuous feature within the saprolite as well. Also, the y-intersection of fractures just to the upper-left of center (indicated by arrows) appears discontinuous in the software-corrected image (B). Sample courtesy of Dr. Gerilynn Moline, Oak Ridge National Laboratory.
Beam hardening can be a pernicious artifact because it changes the CT value of a material (or void) depending upon its location in an image. Thus, the attempt to utilize a single CT number range to identify and quantify the extent of a particular material can become problematic. One measure that is sometimes taken is to remove the outer edges of the image and analyze only the center. Although this technique removes the worst part of the problem, the artifact is continuous and thus even subsets of the image are affected. Furthermore, if the cross-sectional area of the object changes from slice to slice, the extent of the beam-hardening artifact also changes, making such a strategy prone to error.
There are a number of possible remedies for beam hardening, ranging from sample and scanning preparation to data processing. The simplest approach is to use an X-ray beam that is energetic enough to ensure that beam hardening is negligible, and can thus be ignored. Unfortunately, most materials of geological interest are attenuating enough that beam hardening is noticeable unless the sample is quite small. Furthermore, higher-energy beams are less sensitive to attenuation contrasts in materials, and thus may not provide sufficient differentiation between features of interest. Another possible strategy is to pre-harden (or post-harden) the X-ray beam by passing it through an attenuating filter before or after it passes through the scanned object (Fig. 5c). Filters are commonly flat or shaped pieces of metal such as copper, brass or aluminum. The drawback to beam filtration is that it typically degrades the X-ray signal at all energies to some degree, thus leading to greater image noise unless longer acquisition times are used. It is also characteristically only partially effective. Another method is to employ a wedge calibration using a material of similar attenuation properties to the object (Fig. 5d), as discussed above. To be effective, the wedge material should be cylindrical, and the scanned object should either be cylindrical or packed in an attenuating material (ideally the wedge material) to achieve an overall cylindrical form. If the latter is necessary, images may be noisier because of the additional X-ray attenuation caused by the packing material. The wedge material in the images also commonly interferes with 3-D analysis of the object of interest, in which case it must be eliminated during image processing.
Beam hardening is characteristically more difficult to alleviate at the data-processing stage, and such measures are usually available only in special circumstances. If the scanned object is materially uniform, a correction can be applied to the raw scan data that converts each reading to a non-beam-hardened equivalent before reconstruction takes place; unfortunately, the requirement of uniformity is more often met in industrial applications than geological ones. If the object is cylindrical and fairly uniform (i.e., a rock core), it may be possible to construct an after-the-fact wedge correction by compiling a radial average of CT values for a stack of slices. A Fourier filter that removes long-wavelength variations in CT value has also been effective in some circumstances.
Ring Artifacts
Ring artifacts occur in third-generation scanning, appearing as full or partial circles centered on the rotational axis (Fig. 5a). They are caused by shifts in output from individual detectors or sets of detectors, which cause the corresponding ray or rays in each view to have anomalous values; the position of a ring corresponds to the area of greatest overlap of these rays during reconstruction. A number of factors can cause such a shift, all of which have their basis in detectors responding differently to changes in scanning conditions. Some factors, such as change in temperature or beam strength, can be overcome by carefully controlling experimental conditions or by frequent recalibrations. A more problematic source of detector divergence is differential sensitivity to varying beam hardness. If the detector response calibration (gain or wedge) is taken through air, the relative response of the detectors can change if the hardness of the X-ray beam is sufficiently affected by passage through the scanned object. If the object is uneven then different views can reflect different degrees of hardening, in which case only partial rings may occur, possibly obscuring their nature as artifacts.
Because of their link to beam hardening, ring artifacts can be addressed at the scanning stage with many of the same methods: by use of a filtered or sufficiently high-energy X-ray beam, or employing a wedge calibration through a material of similar attenuating properties to the scanned object.
Ring artifacts are somewhat more amenable to software remedies than beam hardening. A series of anomalous readings from a single detector appears on a sinogram as a vertical line, and thus it can potentially be detected and removed before reconstruction. Similarly, a reconstructed image can be converted to polar coordinates, vertical lines detected and removed, and converted back (Fig. 5b). A drawback of these strategies, particularly the latter, is that any roughly linear feature in the scanned object that is tangential to a circle centered on the rotational axis may be erased, blurred, or otherwise altered, even if it does not coincide with a ring. This can constitute a serious flaw in some applications, such as detecting sutures in fossils or tracing fractures.
In second-generation scanning, readings from an anomalous detector traverse the entire scan subject, so no rings are developed. Instead, detector drift is manifested by increased image noise.
Other Artifacts
A variety of other artifacts can arise in certain situations. If a highly attenuating object is noncircular in cross-section, streaks that traverse the longest axes of the object can occur. For example, a scanned cube of a dense material may have dark streaks connecting opposite corners. These streaks can intensify ring artifacts where they overlap, making remediation more difficult. If the scanned material includes features that are of much higher density than the surrounding matrix, a “starburst” artifact can form in which bright streaks emanate from the object for a short distance into nearby material, potentially obscuring features. In several instances we have found that fossils have been repaired with steel pins, resulting in severe artifacts. Similar artifacts have been caused by crystals of sulfide or oxide minerals.
Partial-Volume Effects
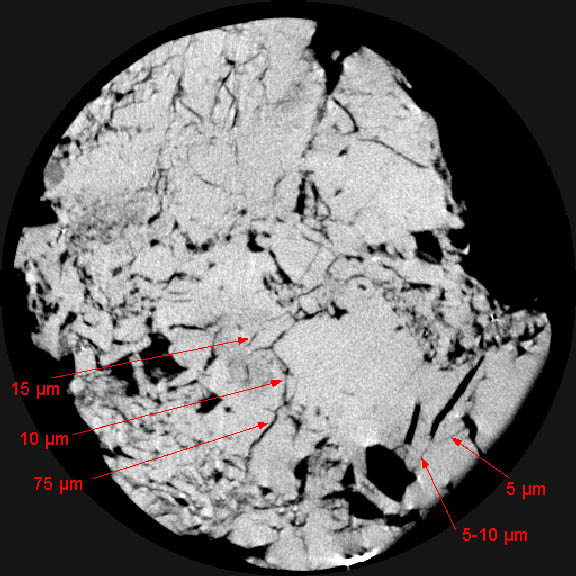
Figure 6: 100-µm slice through fractured limestone from the lower Ismay member of the Paradox Formation. Scan field of view is 21.5 mm, and individual pixels are 42 µm on a side. After scanning the entire volume, the sample was cut and fractures were measured in thin section. Fractures are visible despite being considerably thinner than the pixel width, because of partial volume effects. Sample and measurements courtesy of Dr. Brenda Kirkland, University of Texas at Austin.
Because each pixel in a CT image represents the attenuation properties of a specific material volume, if that volume is comprised of a number of different substances then the resulting CT value represents some average of their properties. This is termed the partial-volume effect. Furthermore, because of the inherent resolution limitations of X-ray CT, all material boundaries are blurred to some extent, and thus the material in any one voxel can affect CT values of surrounding voxels. Although these factors can make CT data more problematic to interpret quantitatively, they also represent an opportunity to extract unexpectedly fine-scale data from CT images. For example, medical CT data have long been used to trace two-phase fluid flow in soil and sedimentary rock cores (Wellington and Vinegar, 1987; Withjack, 1988), even though the fluids themselves appear only as subtle attenuation changes in the matrix they are passing through. Partial-volume effects have also been used to measure crack sizes cracks in crystalline rocks (Johns and others, 1993) and pores in soil columns (Peyton and others, 1992) down to a scale that is considerably finer than even the pixel dimensions.
The interpretation of CT values in voxels containing multiple components is not necessarily straightforward. Wellington and Vinegar (1987) utilize the approximation that the CT value in a voxel containing two components is equal to a linear combination of the CT values of the two end-members according to their volumetric proportions, which provides a reasonable solution if their attenuation values are fairly close (Pullan and others, 1981). If the end-member attenuation values are far apart, as is the case for rock and void space, significant errors of 10% or more can result from this approximation if their boundary is nearly parallel with the scan plane. However, in most cases where randomly oriented voids are studied, this error is significantly lower, and is commonly neglected without large consequence (Johns and others, 1993; Kinney and others, 1993; Wellington and Vinegar, 1987).
An example of the possible utility of partial-volume effects is shown in Figure 6. A core of limestone from the lower Ismay member of the Paradox Formation was scanned and subsequently cut for petrographic analysis (Beall and others, 1996). Individual fractures that appear on the scan were measured petrographically and found to have widths that were significantly smaller than the pixel dimensions. The fracture width can be estimated using partial-volume calculations similar to those used by Johns and others (1993), although at least one additional step is required to take fracture dip into account.
Next: References