
Because industrial X-ray CT scanners are typically custom-built, no detailed description of their principles and operation will apply in all cases. Instead, we provide here a description of each component of the CT-scanning process, both in general terms and as specifically applied using the ACTIS scanner at the University of Texas High-resolution X-ray CT Facility. The material presented in this and subsequent sections is a combination of information provided with the UT system by the manufacturer (Bio-Imaging Research, Inc.; now the Security and Inspection division of Varian Medical Systems, Inc.), insights gained from experience, and general principles derived from the literature. For a more complete technical overview of CT, we recommend ASTM publication E1441-92a (ASTM, 1992) as an excellent starting point. Very readable, if somewhat dated, synopses of medical CT and its components and history can be found in Hendee (1979) and Newton and Potts (1981).
Scanning Configuration
Figure 1: Schematic illustration of different generations of X-ray CT scan geometries. Solid arrows indicate movements during data collection, dashed arrows indicate movement between sequences of data collection. The solid lines passing from the sources to the detectors are ray paths, and each set of solid lines from a single angular orientation constitutes a view. These illustrations show the source and detectors moving around a stationary object, as is the case with medical scanners. The motion is relative, however, and in many industrial scanners the object moves while the source and detectors are stationary. In all cases, the axis of rotation is the center of the circle. A. First-generation, translate-rotate pencil beam geometry. B. Second-generation, translate-rotate fan beam geometry. C. Third-generation, rotate-only geometry. D. Third-generation offset-mode geometry.
The simplest common elements of X-ray radiography are an X-ray source, an object to be imaged through which the X-rays pass, and a series of detectors that measure the extent to which the X-ray signal has been attenuated by the object (Fig. 1). A single set of X-ray intensity measurements on all detectors for a given object position and scanner geometry is termed a view. The fundamental principle behind computed tomography is to acquire multiple views of an object over a range of angular orientations. By this means, additional dimensional data are obtained in comparison to conventional X-radiography, in which there is only one view.
First- through fourth-generation computed tomography systems utilize only rays in a single plane: the scan plane. In first-generation CT (Fig. 1a) this is done by directing a pencil beam through the object to a single detector, translating the source-detector pair across the extent of the object in the scan plane, then repeating the procedure from a number of angular orientations. Second-generation CT (Fig. 1b) uses the same scanning procedure, but a fan beam replaces the pencil beam and the single detector is replaced by a linear or arcuate series of detectors, leading to a higher rate of data acquisition. In typical third-generation CT (Fig. 1c), the fan beam and detector series are wide enough to encompass the entire object, and thus only rotation of the object or the source-detector combination is required. One variation of third-generation scanning offsets the sample from the center of the fan beam so that a part of it is outside of the beam, but the center of rotation is within it (Fig. 1d). As the object rotates, all of it passes through the fan beam, which permits reconstruction of a complete image. This technique allows larger objects to be scanned and permits smaller objects to be moved closer to the source into a narrower section of the fan beam, leading to increased resolution through enhanced utilization of detectors to image smaller subsections of the object in any one view. Third-generation scanning tends to be much faster than second-generation, as X-rays are utilized more efficiently. Most modern medical scanners are fourth-generation devices, consisting of a fixed complete ring of detectors and a single X-ray source that rotates around the object being scanned. In first- through third-generation scanners the motion between the object being scanned and the source-detector pair is relative, and can be accomplished either by keeping the object stationary and moving the source-detector pair, as is done in medical CT systems, or vice versa as is more common in industrial systems.
In volume CT, a cone beam or highly-collimated, thick, parallel beam is used rather than a fan beam, and a planar grid replaces the linear series of detectors. This allows for much faster data acquisition, as the data required for multiple slices can be acquired in one rotation. However, it is also computationally more intensive, prone to distortion, and in many cases provides lower-resolution images. Whereas volume CT has been largely perfected for some of the most advanced medical systems, and is ideally suited for tomography using parallel-beam synchrotron radiation, for most industrial scanners it does not yet provide the same quality of imagery as single-slice arrangements.
X-Ray Source
Figure 2: Theoretical energy spectra for a 420-kV X-ray source with a tungsten target, calculated combining 5-keV intervals. The spectra consist of continuous Bremsstrahlung and characteristic K-series peaks at 57-59 keV and 67-69 keV. The upper spectrum is modified only by inherent beam filtration by 3 mm of aluminum at the tube exit port. The mean X-ray energy is 114 keV. The lower curve represents a spectrum that has also passed through 5 cm of quartz. The preferential attenuation of low-energy X-rays causes the average energy to rise to 178 keV.
The important variables that determine how effective an X-ray source will be for a particular task are the size of the focal spot, the spectrum of X-ray energies generated, and the X-ray intensity. The focal-spot size partially defines the potential spatial resolution of a CT system by determining the number of possible source-detector paths that can intersect a given point in the object being scanned. The more such source-detector paths there are, the more blurring of features there will be. The energy spectrum defines the penetrative ability of the X-rays, as well as their expected relative attenuation as they pass through materials of different density. Higher-energy X-rays penetrate more effectively than lower-energy ones, but are less sensitive to changes in material density and composition. The X-ray intensity directly affects the signal-to-noise ratio and thus image clarity. Higher intensities improve the underlying counting statistics, but often require a larger focal spot.
Many conventional X-ray tubes have a dual filament that provides two focal-spot sizes, with the smaller spot size allowing more detailed imagery at a cost in intensity. Medical CT systems tend to have X-ray spot sizes that range from 0.5 mm to 2 mm. The high-energy subsystem at UTCT utilizes a dual-spot 450-kV X-ray source (GE Isovolt Titan E), with spot sizes of 0.4 and 1.0 mm. The small spot has a maximum load of 720 W (i.e., 1.6 mA at 450 kV), whereas the large spot has a maximum load of 1485 W. The 225 kV tube used for ultra-high resolution work (Feinfocus FXE-225.20) has an adjustable focal spot with a minimum size of <6 µm at 8 W total load, but at higher loads the spot size is automatically increased to prevent thermal damage to the target. In most cases a slightly “defocused” beam (larger spot size) can be used to improve counting statistics with little cost in resolution. Both sources have tungsten targets.
The energy spectrum generated is usually described in terms of the peak X-ray energy (keV or MeV), but actually consists of a continuum in which the level with maximum intensity is typically less than half of the peak (Fig. 2). The total “effective” spectrum is determined by a number of factors in addition to the energy input of the X-ray source itself, including autofiltering both by absorption of photons generated beneath the surface of a thick target (Silver, 1994) and by passage through the tube exit port; other beam filtration introduced to selectively remove low-energy X-rays; beam hardening in the object being scanned; and the relative efficiency of the detectors to different energies. As discussed below, changes in the X-ray spectrum caused by passage through an object can lead to a variety of scanning artifacts unless efforts are made to compensate for them.
X-Ray Attenuation
As the X-rays pass through the object being scanned, the signal is attenuated by scattering and absorption. The basic equation for attenuation of a monoenergetic beam through a homogeneous material is Beer’s Law:
(1) ![]() ,
,
where I0 is the initial X-ray intensity, µ is the linear attenuation coefficient for the material being scanned (units: 1/length), and x is the length of the X-ray path through the material. If the scan object is composed of a number of different materials, the equation becomes:
(2) ,
,
where each increment i reflects a single material with attenuation coefficient µi over a linear extent xi. To take into account the fact that the attenuation coefficient is a strong function of X-ray energy, the complete solution would require solving the equation over the range of the effective X-ray spectrum:
(3)  .
.
However, such a calculation is usually problematical for industrial CT, as the precise form of the X-ray spectrum, and its variation at off-center angles in a fan or cone beam, is usually only estimated theoretically rather than measured. Furthermore, most reconstruction strategies solve equation (2), insofar as they assign a single value to each pixel rather than some energy-dependent range.
Figure 3: Linear attenuation coefficient as a function of X-ray energy for four rock-forming minerals. Such curves, when combined with the X-ray spectrum utilized for scanning (Fig. 2), allow prediction of the ability to differentiate between minerals in CT images.
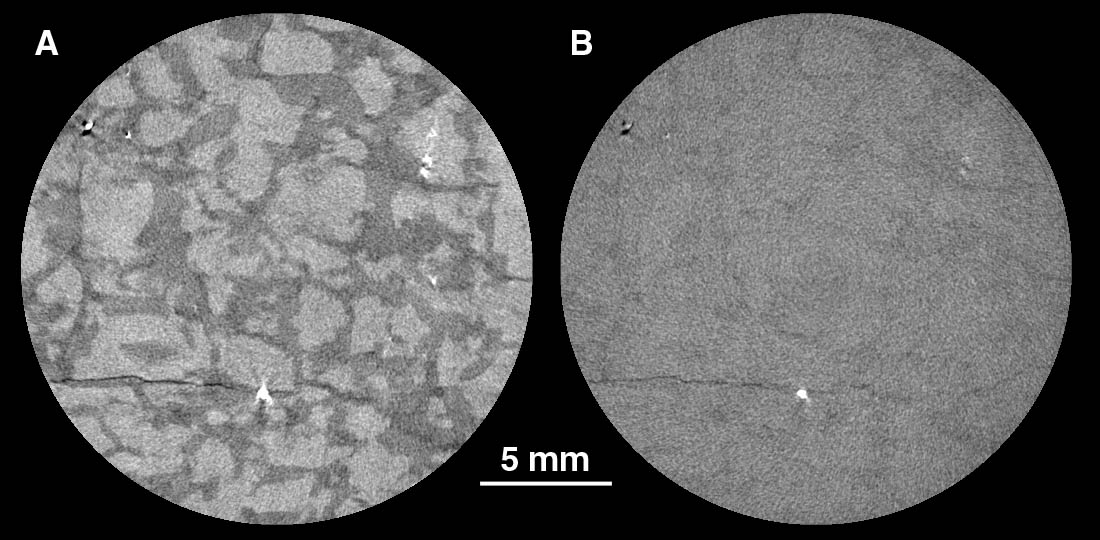
Figure 4: A core of graphic granite imaged at various energy conditions. The field of view diameter for each image is 22 mm, and the slice thickness is 100 µm. Scan (A) was created using an X-ray energy of 100 keV and no beam filtration; scan (B) was acquired with an X-ray energy of 200 keV and a 1/8″ brass filter. Both scans employed a “self-wedge” calibration.
There are three dominant physical processes responsible for attenuation of an X-ray signal: photoelectric absorption, Compton scattering, and pair production. Photoelectric absorption occurs when the total energy of an incoming X-ray photon is transferred to an inner electron, causing the electron to be ejected. In Compton scattering, the incoming photon interacts with an outer electron, ejecting the electron and losing only a part of its own energy, after which it is deflected in a different direction. In pair production, the photon interacts with a nucleus and is transformed into a positron-electron pair, with any excess photon energy transferred into kinetic energy in the particles produced.
In general for geological materials, the photoelectric effect is the dominant attenuation mechanism at low X-ray energies, up to approximately 50-100 keV. Compton scatter is dominant at higher energies up to 5-10 MeV, after which pair production predominates. Thus, unless higher-energy sources are used, only photoelectric absorption and Compton scattering need to be considered. The practical importance of the distinction between mechanisms is that photoelectric absorption is proportional to Z4-5, where Z is the atomic number of an atom in the attenuating material, whereas Compton scattering is proportional only to Z (Markowicz, 1993). As a result, low-energy X-rays are more sensitive to differences in composition than higher-energy ones.
The best way to gain insight into what one might expect when scanning a geological sample is to plot the linear attenuation coefficients of the component materials over the range of the available X-ray spectrum. These values can be calculated by combining experimental results for atomic species (e.g., Markowicz, 1993). Alternatively, mass attenuation coefficients can be obtained from the XCOM database managed by NIST. Mass attenuation coefficients must be multiplied by mass density to determine linear attenuation coefficients. To illustrate, Figure 3 shows curves for four minerals: quartz, orthoclase, calcite, and almandine garnet. Quartz and orthoclase are very similar in mass density (2.65 g/cm3 vs. 2.59 g/cm3), but at low energy their attenuation coefficients are quite different because of the presence of relatively high-Z potassium in the feldspar. With rising X-ray energy, their attenuation coefficients converge, and at approximately 125 keV they cross; above ~125 keV quartz is slightly (but probably indistinguishably) more attenuating, owing to its higher density. Thus, these two minerals can be differentiated in CT imagery if the mean X-ray energy used is low enough, but at higher energies they are nearly indistinguishable (Fig. 4). Calcite, though only slightly denser (2.71 g/cm3) than quartz and orthoclase, is substantially more attenuating, owing to the presence of calcium. Here the divergence with quartz persists to slightly higher energies, indicating that it should be possible to distinguish the two even on higher-energy scans. High-density, high-Z phases such as almandine are distinguishable at all energies from the other rock-forming minerals examined here.
X-Ray Detectors
Detectors for CT scanners make use of scintillating materials in which incoming X-rays produce flashes of light that are counted. Detectors influence image quality through their size and quantity, and through their efficiency in detecting the energy spectrum generated by the source. The size of an individual detector determines the amount of an object that is averaged into a single intensity reading, while the number of detectors determines how much data can be gathered simultaneously. In third-generation scanning, the number of detectors also defines the degree of resolution possible in a single view, and thus in an image overall. The film used in conventional X-ray radiography is an excellent detector in that it consists, in essence, of a very large number of small and sensitive detectors. Unfortunately, it is not amenable to quickly producing the digital data needed for computed tomography.
The efficiency of scintillation detectors varies with X-ray energy, precisely because higher-energy X-rays are more penetrative than lower-energy ones, indicating that they are more capable of traveling through materials without interactions. This factor must be taken into account when determining the level of expected signal after polychromatic X-rays pass through materials.
The high-energy subsystem at UTCT has two separate detectors. The P250D detector consists of a linear array of 512 discrete cadmium tungstate scintillators with dimensions 0.25 mm x 5.0 mm x 5.0 mm, packed in a comb to prevent crosstalk between channels, and each connected to a Si photodiode. Its channel-to-channel pitch is 381 µm, and its total horizontal extent is 195 mm. The RLS (Radiographic Line Scanner) detector consists of a single 0.25 mm-thick gadolinium oxysulfide scintillator screen connected to a 2048-channel linear photodiode array using a fiber optic taper. The detector spacing is 50 µm, and the total detector extent is approximately 100 mm. The ultra-high-resolution subsystem uses a 9-inch image intensifier (Toshiba AI-5764-HVP) as a detector. The image intensifier consists of a partial sphere of cesium iodide scintillators attached to a photocathode. The signal from the photocathode is electronically focused onto a phosphor screen, producing a real-time X-ray image. The image on the phosphor is converted to digital data using a 1024×1024 CCD video camera. The video signal, consisting of scan lines divided into pixels, is used to create a set of 1024 virtual detectors by software.
Next: Acquisition of CT Data