The following overview is excerpted from: Ketcham, R.A., and Iturrino, G.J. (2005) Nondestructive high-resolution visualization and measurement of anisotropic effective porosity in complex lithologies using high-resolution X-ray computed tomography. Journal of Hydrology, 302, 92-106.
Align3D is a collection of IDL routines that implement a three-dimensional alignment and subtraction of two HRXCT data sets, also known as “subtraction analysis.” If a sample is scanned twice in different states, once dry and once saturated with a fluid, the difference between the two data sets corresponds to the location of fluid in the second scan. This in turn reveals the interconnected, or “effective” porosity of the sample. A uniquely powerful aspect of this analysis is that it provides the porosity in each data voxel as a fractional value (i.e. from 0 to 100%), and provides essentially limitless resolution: even micro-pores far smaller than the resolution of the CT data are reflected in the fractional porosity data. The three-dimensional effective porosity map provided by this analysis can be used to gain insight into the rock and mineral structures behind permeability and flow characteristics. It also opens the possibility of determining the three-dimensional anisotropy of permeability. The HRXCT analysis is essentially non-destructive, as any fluid, including distilled water or groundwater in equilibrium with the sample material, can be employed.
Click here to download Align3D via Box.
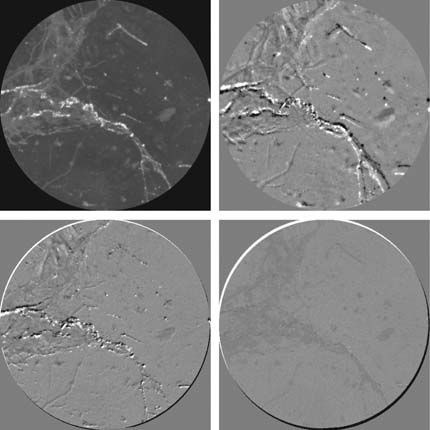
Example of Align3D data-alignment procedure. Top left shows slice from the “dry” scan of ODP deep-sea sample 1189A-8R, a rock that was probably originally a diorite but has been extensively altered by hydrothermal fluids associated with ocean-floor spreading. Image field of view is 24 mm. Top right shows the same slice with the corresponding slice from the “wet” scan subtracted and renormalized; light and dark areas show misfit. Bottom left shows subtraction after an intermediate stage of fitting, and bottom right shows the final fit after best-fit three-dimensional transformation has been found; subtle gray-level variations now reveal location of porosity-filling water (from Ketcham and Iturrino, 2005).
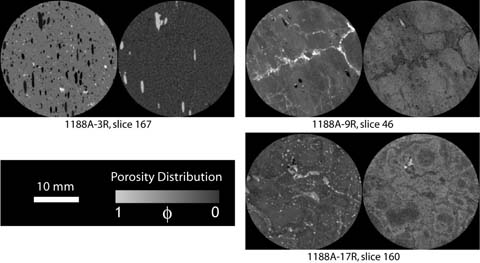
Example scan images (left) and porosity maps (right) for various deep-sea samples. Field of view for each image is 24 mm, and each CT slice represents a 57.8 mm thickness of material. Top left sample has many vesicles (gas bubbles), but porosity scan shows that few of them are interconnected, even by microporosity, explaining the low permeability of this rock. Top right sample is cross-cut by a sulfide-anhydrite vein, which was once a fluid conduit but now is a fluid barrier; the microporosity fabric to either side is actually perpendicular to the vein. Anhydrite-filled vesicles are also non-porous. Extensive alteration in the bottom right sample has produced a complex network of microporosity defined by alteration rims and occasional conduits (from Ketcham and Iturrino, 2005).
Papers Utilizing Align3D
Gipps, P., & Gu, K. (1999) Some experience with geospatial imagery and route optimization. Transportation Research Record: Journal of the Transportation Research Board, 143-152.
Ketcham, R.A., and Iturrino, G.J. (2005) Nondestructive high-resolution visualization and measurement of anisotropic effective porosity in complex lithologies using high-resolution X-ray computed tomography. Journal of Hydrology, 302, 92-106. Supplemental material: http://www.ctlab.geo.utexas.edu/pubs/ketcham&iturrino/k&i.htm
Rowe, T. B., Luo, Z. X., Ketcham, R. A., Maisano, J. A., & Colbert, M. W. (2016) X-ray computed tomography datasets for forensic analysis of vertebrate fossils. Scientific data, 3, 160040.