SUPPLEMENTAL MATERIAL FOR:

Ketcham, R.A. and Koeberl, C. New textural evidence on the origin of carbonado diamond: an example of 3D petrography using X-ray CT. Submitted to Geosphere.

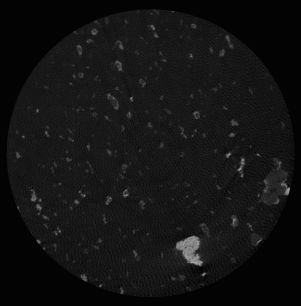
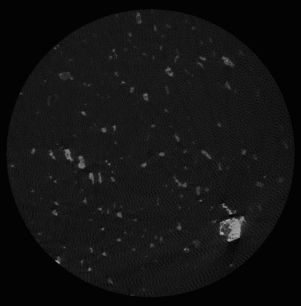
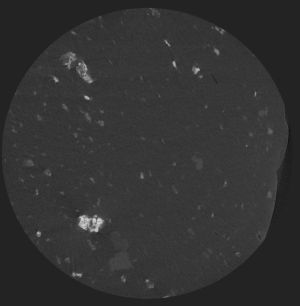
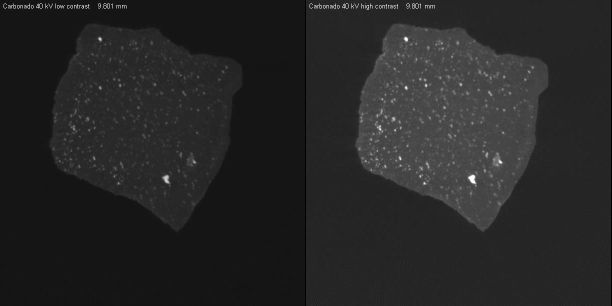
Animation S1:
Individual slice animation for a 29.2 µm resolution data set of carbonado acquired with X-rays set at 40 kV, at two contrast levels. Patinaed side of specimen is on right side of images.
Images are 17.9 mm wide.

1224x612 pixels; 10.4 MB

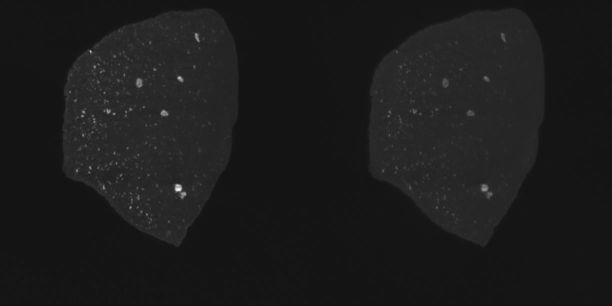
Animation S2:
Individual slice animation for 29.2 µm resolution data sets of carbonado acquired with X-rays set at 40 kV (left) and 140 kV (right). Patinaed side of specimen is on right side of images.
Images are 17.9 mm wide.

1224x612 pixels; 6.0 MB

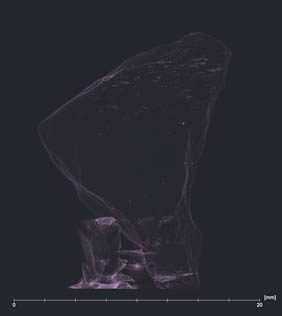
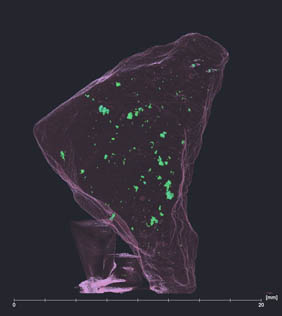
Animations S3, S4:
3D volume rendering animations for 29.2 µm data sets, corresponding to Fig. 4a (left: 140 kV, CT number > almandine) and Fig. 4b (right: 40 kV, CT number ≥ almandine).

S3: 903x1013 pixels; 7.8 MB

S4: 903x1013 pixels; 7.2 MB

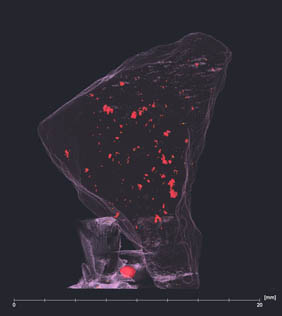
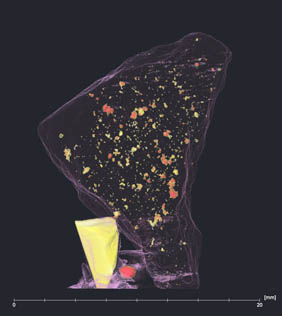
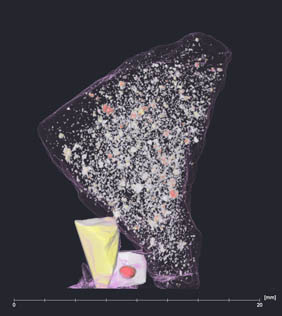
Animations S5, S6:
3D volume rendering animations for 29.2 µm data sets, corresponding to Fig. 4c (left: 40 kV, CT number ≥ apatite) and Fig. 4d (right: 40 kV, CT number ≥ calcite). Reference minerals around bottom are apatite (yellow), almandine (red) and calcite (white).

S5: 903x1013 pixels; 6.7 MB

S6: 903x1013 pixels; 6.0 MB

Animation S7:
3D volume rendering animation for 40 kV, 29.2 µm data set, with only CT numbers ≥ metal shown (small orange particles around specimen edges).

903x1013 pixels; 6.7 MB


Animations S8, S9:
Individual slice animations for 40 kV, 5.4 µm data sets encompassing different regions of the specimen interior.
Images are 5.3 mm wide.

S8: 1006x1024 pixels; 15.1 MB

S9: 1006x1024 pixels; 14.9 MB

Animation S10:
Individual slice animation for longer-acquisition 40 kV, 5.4 µm data set of specimen interior. Denser angular sampling reduced interference artifacts making porosity more apparent. Patinaed side appears along right edge.
Images are 5.3 mm wide.

S10: 992x1013 pixels; 57 MB

Animations S11, S12:
Volume renderings of individual pseudomorphs based on 5.4 µm data. S11 (left) corresponds to Fig. 7A, and S12 (right) corresponds to Fig. 7B. Probable florencite is rendered opaque white, and phases with lower attenuation are semi-transparent green.

S11: 512x512 pixels; 2.7 MB

S12: 1024x620 pixels; 4.2 MB

Animations S13, S14:
Individual slice animations for 40 kV, 1.0 µm data sets encompassing smaller sub-volumes of specimen interior. S13 (left) shows various pseudomorphs containing abundant florencite (bright material) and S14 shows a pseudomorph containing exclusively kaolinite.
Images are 1 mm wide.

S13: 341x318 pixels; 4.3 MB

S14: 454x495 pixels; 17.8 MB