|
|
 |
 |
|
|
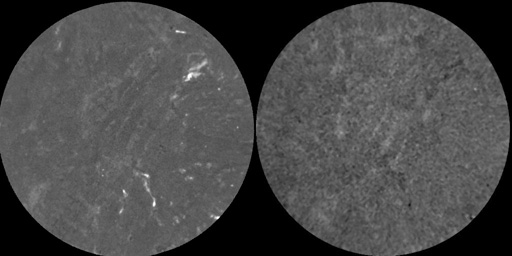
193-1188A-9R-1, 118-120 |
 |
 |
|
 |
|
 |
|
 |
|
 |
|
 |
SUPPLEMENTAL MATERIAL FOR:
Ketcham, R.A. and Iturrino, G.J. (2005) Nondestructive high-resolution visualization and measurement of anisotropic effective porosity in complex lithologies using high-resolution X-ray computed tomography: Application to a deep-sea hydrothermal system. Journal of Hydrology, 302, 92-106.Click here for Appendix and source code file.
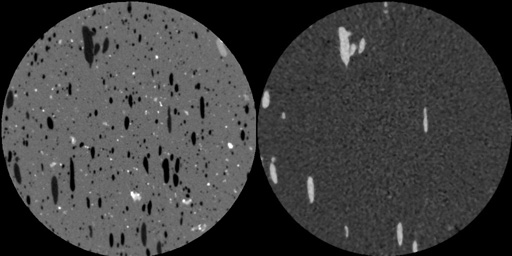
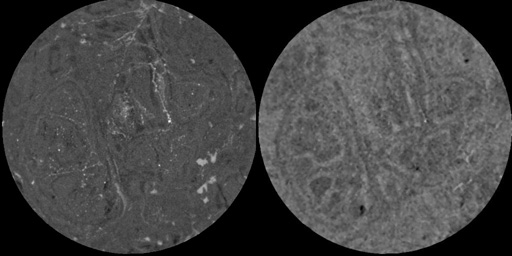
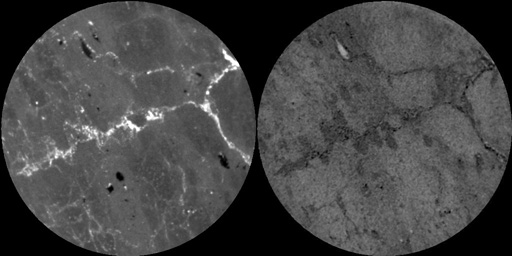
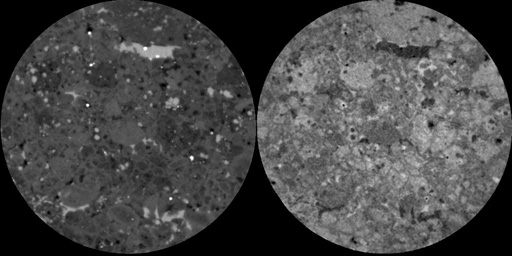
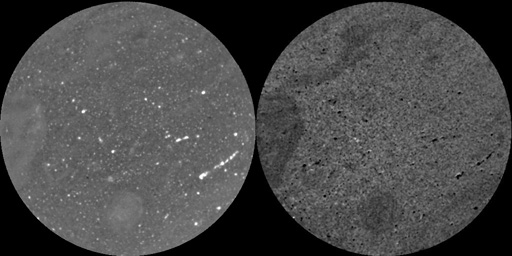
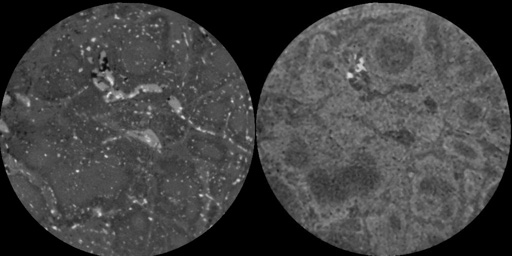
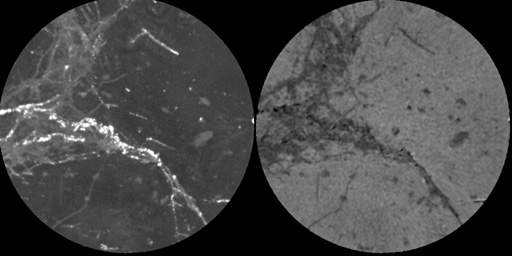
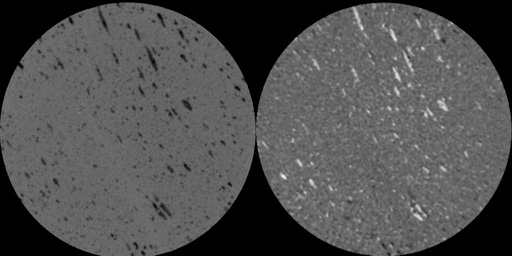
Data stacks: For each sample, the image on the left is a single representative CT slice, with gray level corresponding to X-ray linear attenuation coefficient, a function of density and atomic number. Field of view for each image is 24 mm, and each CT slice represents a 57.8 µm thickness of material. The right side images are maps of partial porosity, in which lighter shades of gray indicate higher porosity. In the first sample (193-1188A-3R-1, 13-15), the partial porosity image consists of filled vesicles (light) and impermeable matrix (dark); these endmember grayscales apply across all of the partial porosity maps, but other samples tend to show more throughgoing microporosity.
|
|
|
|
|
|
193-1188A-9R-1, 118-120 |
|
|
|
|
|
|
|
|
|
|
|
|
![]()